

Dev Productivity: Which Metric(s) Do I Use
"A bad system will beat a good person every time." - W. Edwards Deming

Today we continue on our series looking at measuring developer productivity. In the previous post, we went into detail on why it's difficult to measure.
While difficult, it doesn't mean it's impossible. It's also not the only space that deals with this sort of complexity. We'll begin by looking at what is done in manufacturing, an area that deals with similar complexity and then dive into what industry metrics are available for measuring developer productivity.
Vehicle Manufacturing
Manufacturing has faced balancing productivity with quality for longer than software engineering teams. Picture this - it's the 1950s World War II has ended, Japan is focusing on post-war reconstruction; they also happened to be influenced by American culture as the US remained there until 1952. The automotive industry was in it's infancy there but the government was providing incentives for affordable & efficient domestic vehicles.
On the other hand, we have Toyota which was on the verge of bankruptcy in 1949 and bailed out by the government. They needed to shift direction and produce vehicles in a way they hadn't especially since they also had a US military contract for vehicles during Korean War. Toyota’s Taiichi Ohno and Kiichiro Toyoda drew inspiration from Henry Ford's assembly line and created the Toyota Production System (TPS).
By the 1970s, they were dominating the manufacturing market and had formalized their method. Ironically, when GM executives visited in 1980s to learn from Toyota but assumed they were hiding information and ignored it.
Let's review Toyota Production System and see what we can apply to the software engineering space. TPS management philosophy focused on lean manufacturing, empowering employees, and process improvement. Some of the key underlying principles were:
Just-in-time (JIT) production - minimize inventory and waste, producing only what's needed at that time.
Kaizen - a culture of continuous improvement across the organization
Jidoka (Automation with a human touch): Anyone in the production process had the ability to halt if a defect was found, focusing on quality.
The focus was primarily on process improvements, standardizing work, and waste elimination. From this philosophy a lot of lean tools that we've adopted in software engineering were created: value stream mapping, kanban boards, and total productive maintenance. In fact, this led to the Toyota Kata Method in 2009 which took the improvement and coaching tools to create behavioral patterns, scientific thinking approaches, and continuous learning in other industries.
Where To Measure
Before we dive into the metrics, let's take a moment to understand where we should be measuring. I understand the article is about individual developer productivity, but that's an incomplete picture. The goal isn't individual productivity but rather a cohesive output. It means we should be looking at contributions at multiple levels:
Individual
Team
Systems
Organization
Metrics at all these levels need to tie in with value to client, and organizational objectives.
DORA
The two philosophies mentioned above influenced DevOps Research and Assessment (DORA) program. The team behind DORA produced regular industry assessments and looked for patterns that differentiated high performing organizations from low performing ones.
From all these surveys, patterns began to emerge highlighting 4 key metrics that differentiated between high performers and low performers (organizational level):
Deployment Frequency - One of the key aspects of lean manufacturing was small batches of work, it made it easier to measure and improve. In software, we're not producing the same item all the time so it's difficult to measure a batch. If smaller batches of work were completed, they would be deployed more frequently and that became the standard. Focus on how frequently an organization deploys to production. High performers consistently deployed frequently.
Lead Time for Changes - in manufacturing, lead time is the time from raw materials to finished goods. For software engineering, the measurement focuses on when changes are committed to running in production. Shorter lead times equates to efficient process, similar to just-in-time mentioned above.
Change Failure Rate - This metric focuses on quality; it measures what percentage of deployments result in a failure in production. Obviously, lower failure rates means higher quality of code.
Mean Time to Restore - Should a failure happen how quickly can the business recover? This metric measures the average time to recover from a failure in production. Better restoration times means the team can effectively respond to incidents.
Underlying these four metrics was the goal for continuous improvement, benchmarking to understand where teams performed against industry standards, and focus towards business value leading to customer satisfaction.
Deployment Frequency introduces benefits for teams as integration, validation are completed frequently. Lead time provides insights into any waste or inefficiencies in the development lifecycle. Change failure rate means the team is ideally not pushing in items that are incomplete, and MTTR provides insights to the team collaboratively getting the system back up. While these are excellent metrics, they don't target individual performance rather mostly team metrics with deployment frequency focusing on the system.
SPACE
We've all had those days our flow is sublime - you might be knocking off tasks that would take days or weeks in a matter of hours. You're in the zone, and feeling great. That is actually what we want to encourage. The goal of metrics and key performance indicators is to answer "is it the right environment for our developers and engineers to successfully deliver?"
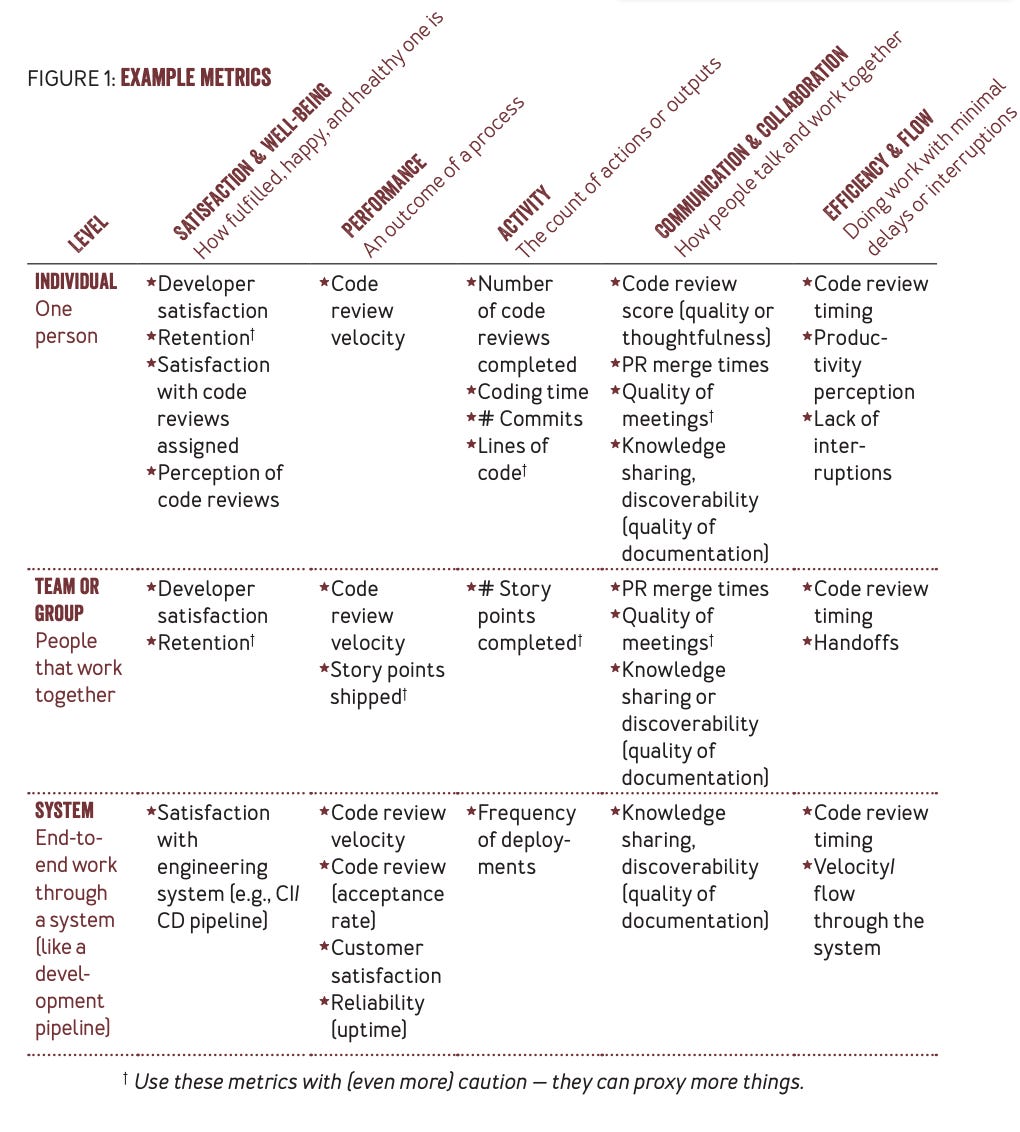
We explore another framework that focuses on developer productivity. The SPACE model focuses on multiple levels from individual and team to system metrics. Let's break down the acronym and the areas of productivity that are measured:
Satisfaction and well-being - this is incredibly important and often overlooked. A developer may be making record number of commits but inching towards burnout leading to poor productivity or they may even quit.
Performance - as mentioned in the previous article, code commits don't relate to performance. Output measurement can easily be gamified. We want to measure outcomes such as quality and impact to customers - this can include customer satisfaction, adoption, retention, etc.
Activity - used in isolation, this can be incredibly misleading and maybe mistaking busy work for productivity. As part of a healthy system, it can provide valuable insights. Typically, we would be looking at outputs from the following activities: design and coding, continuous integration and deployment, operational activities such as incident management.
Communication and collaboration - we've already discussed that development is a team support so effective communication and collaboration are paramount. Information flow at the right time is crucial for success and that is achieved by higher transparency and insights into team member tasks and priorities. This can impact everything from onboarding time for new team members to reduced quality checks required from individuals.
Efficiency and flow - unnecessary tasks and meetings can be draining for productivity. The goal is to allow someone to get in the positive mindset to produce their best work, that means minimizing interruptions. The company 37Signals does a great job of this where developers have office hours, and meetings can only be booked during that time (similar to what professors do in universities). At higher levels, it means minimizing waste, the DORA metrics fit in here well.
Below is the table that shows what needs to be measured for each space and at what level (source).
In terms of decision making based on data, we know asking the right questions is imperative to getting ideal results. While it might be tempting to measure all these metrics, it would be too much to introduce at once leading to fatigue and indecision. Gathering too much data might lead to the wrong signals. Next week we will dive into how to measure these signals to align with business.
Have a comment, question or thoughts then leave a comment
If you found this article helpful please help spread the word by sharing the article with the link below.
If you haven’t already subscribed, subscribe with the link below.